Realstate-Data-Analysis
This summaries of the analysis in Tableau graphs
Background
Data consists of n = 57258 real state properties from the states of Arizona, Alaska, Oregon, California, New Mexico, Texas, and Mexico. Only 11 listings are out of Arizona state, so they are excluded in this analysis. The data used are all listings in Arizona. Data comes with 15 variables in total. Variables describes information about the listings such as Geo location, list price, closing price, number of bedroom, house size and etc.,
Visualization
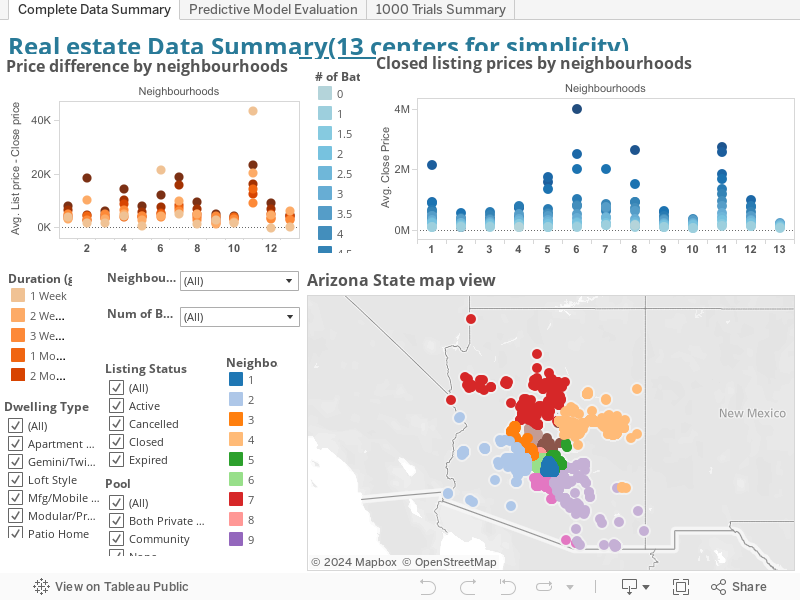
Complete Summary tab: It is a summary of all listing data without cleaning, filtering. For simplicity reason, they divided into 13 neiboughhoods at this tab
Predictive Model Evaluation tab: In the geo map, the number on top is the actual closing price; the numbers on the bottom are the differences of predicted prices to actual prices. Difference_range is a filter segmented in absolute difference
1000 Trials Summary tab: The data set is randomly divided for cross validation, in 1000 different seeds. (set.seed(i)), Pred_diff, is the ABSOLUTE difference of predicted prices to actual prices. This model prediction' is off on average of $29388, compared to human prediction
Goal
The goal is to predict the actual market prices of properties in Arizona State, using all information including external data sources.
Data Cleaning & Methodologies
- Variable "Comments" is held for future analysis
- Listings that have no "ClosePrice" data, but with listing status as "Closed" are excluded.
- Listings of non "Mobile housing", but with price "< $30000" are excluded.
- Listings with 100+ bathrooms are converted to second maximum number of 25 bathrooms
- New variable: "Price_diff": the value of closing price minus listing price
- New variable "duration": the length of time a listing has been posted
- New variable "neighbour": clustering results, at k = 70, it shows the best estimation
- New variable "others": factor variable of "unusually big, expensive" houses and "normal" houses
1. Clustering: Use kmeans method on Latitude and Longitude to divide the data into 70 clusters(cities). 70 was determined by MLE on the main model in a separate file.
2. Cross validation: 80% of listings are randomly chosen proportionally to their cluster size as "train data set"; 20% are chosen to be the "test data set"
3. Repetition: Cross validation process is taken 1000 times, the final results will be taken by the average of them.
4. Interactive effects: Interactive effects of key variables are fully considered in the model.
The post-cleaned data reduces to n = 55333Versions of the analysis
Version 1: Using the existing data to build the predictive model, without variable "list price"
Version 2: Using the existing data to build the predictive model, with variable "list price"
Version 3: Importing external data sources:- Actual GIS information of neizbourghoods, Cities in Arizona state, and accurately assign listings to its location
- Identify locations of Supermarket, malls, schools, hospitals and etc., calculated average distance of a house to its nearest stores.
- Mortgage interest rates in according to properties' listed time
- ...
Version 4: Ideal data set will include Years of the house; number of garages; decoration cost; buyer's payment method and etc.,
Conclusions
Version 1 conclusion: The average of Pred_diff is around $35000, and estimations have both lower-than and higher-than situations, suggesting there are other unknown factors affecting pricing
Moreover:
- This model estimation is poor when the house's livingarea goes over 2000ft, especially in non-urban areas, suggesting possibilities of additional factors that influence large houses'prices, such as their architectues styles, the farms they come with
- The longer a house is on market,the worse prediction the model is. For houses sold within 71 days, the prediction error is the lowest.
- On average, the actual closing price is about $8000 lower than original listing price
- Listings that have not been sold tend to have much larger predictive dicrepency, suggesting they might have unreasonable high pricing.
Version 2 conclusion: (Done in another file)When the additional variable "list price" is added, the prediction model almost makes the estimation perfectly. Suggesting human estimation provide valuable information other than current 15 variables.
Version 3 conclusion: (To be continued)
Support or Contact
You can contact me through My linkedin